Dashboard
A dark mode analytics dashboard for engineering managers to monitor team velocity, sprint health, CI/CD pipelines, and workload — without switching between tools.
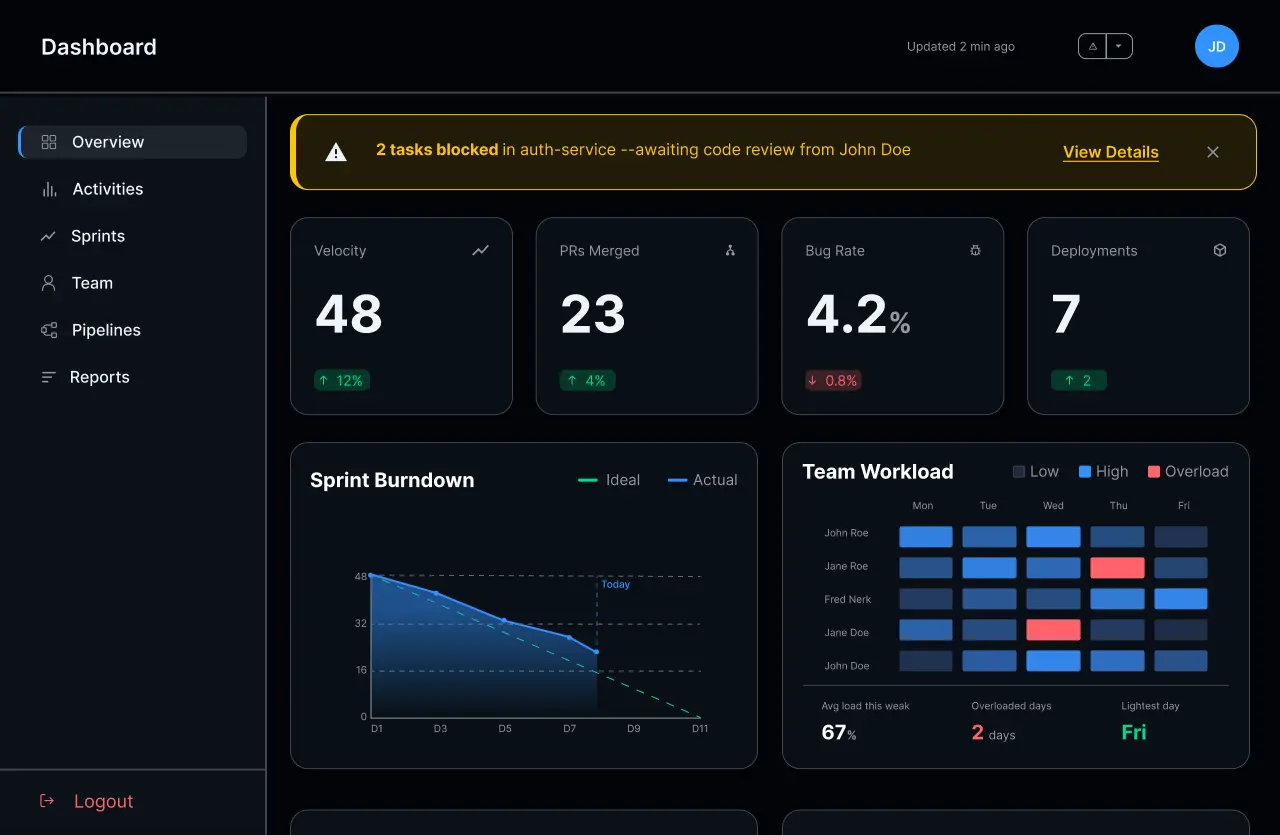
Designed for engineering managers to monitor team health at a glance without switching between tools.
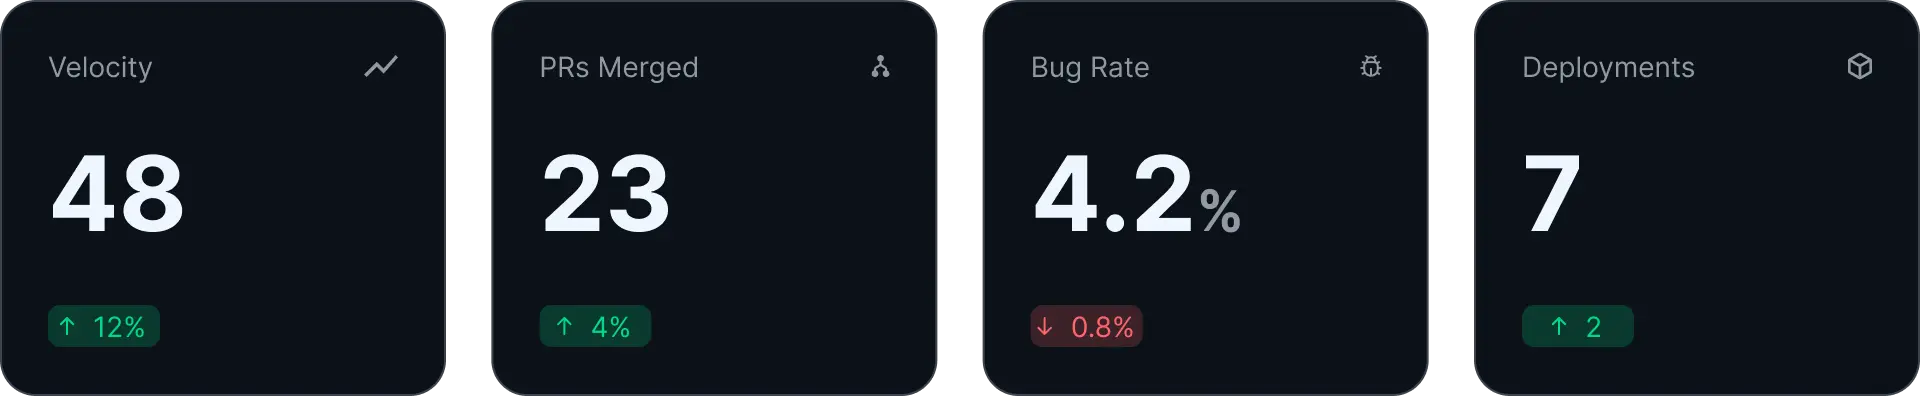
KPI Cards
High-level metrics for velocity, PRs merged, bug rate, and deployments. Each card includes a delta badge showing trend direction, color-coded green for improvement and red for regression.
Graphs & Analytics
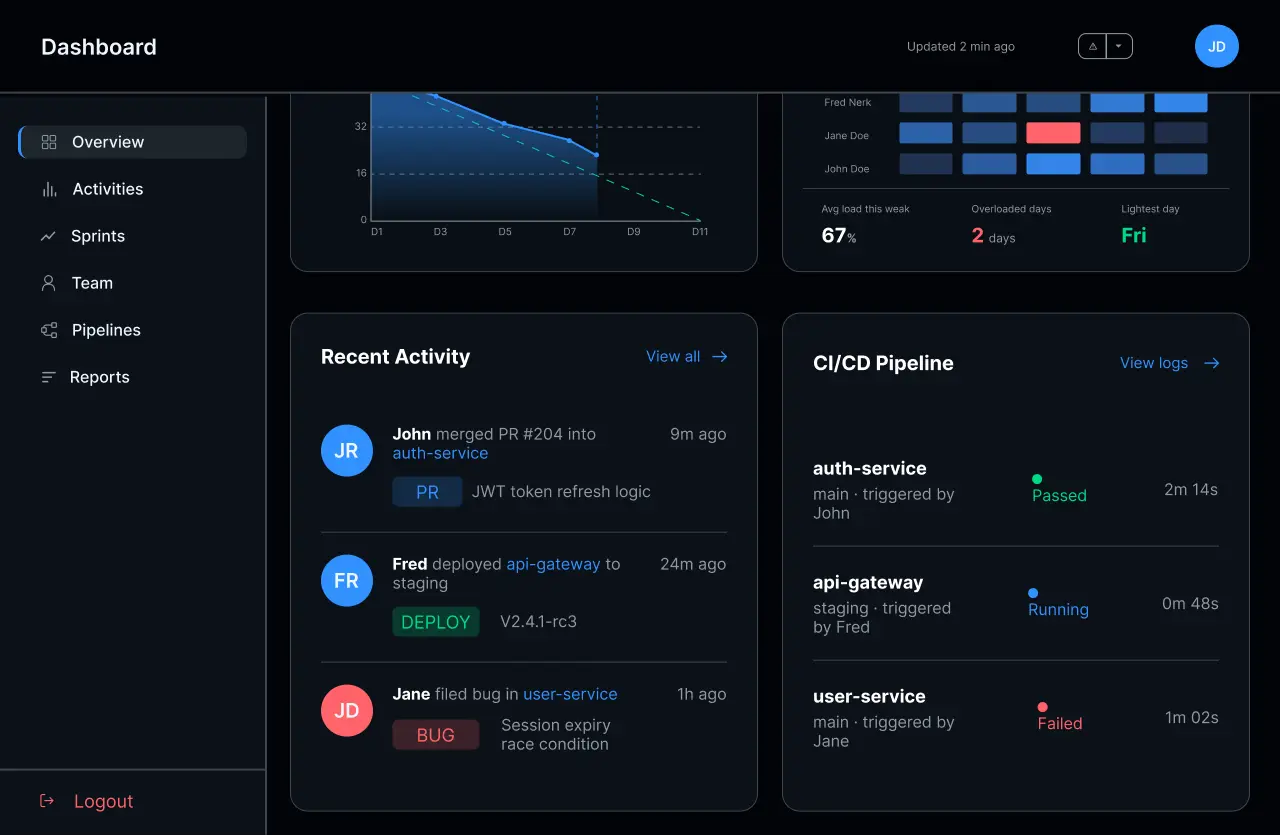
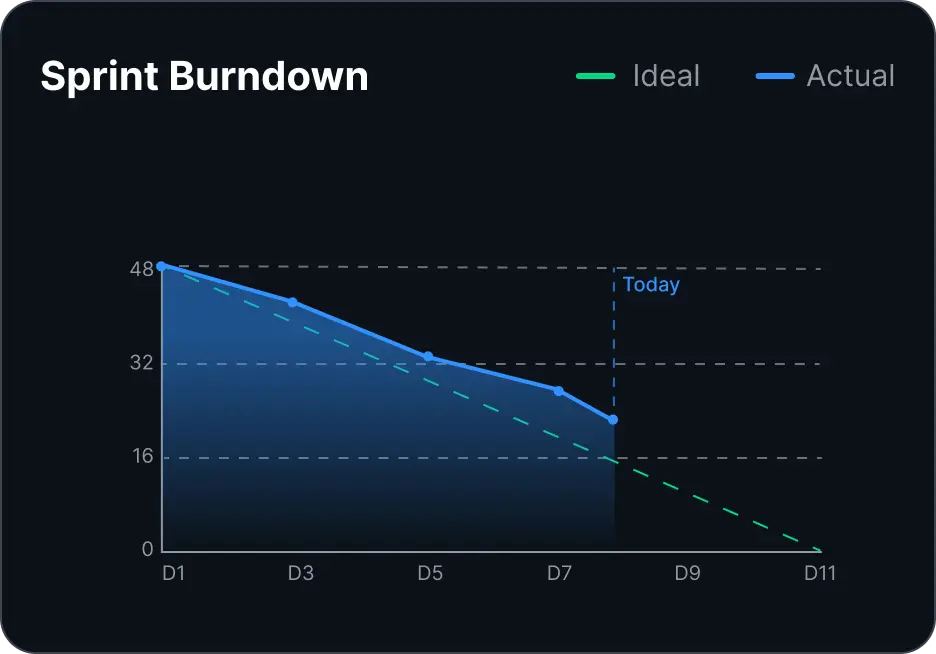
Sprint Burndown
Sprint burndown tracks actual progress against the ideal line. The gradient fill under the actual line and the 'Today' marker give the engineering manager an immediate read on whether the sprint is on track or behind.
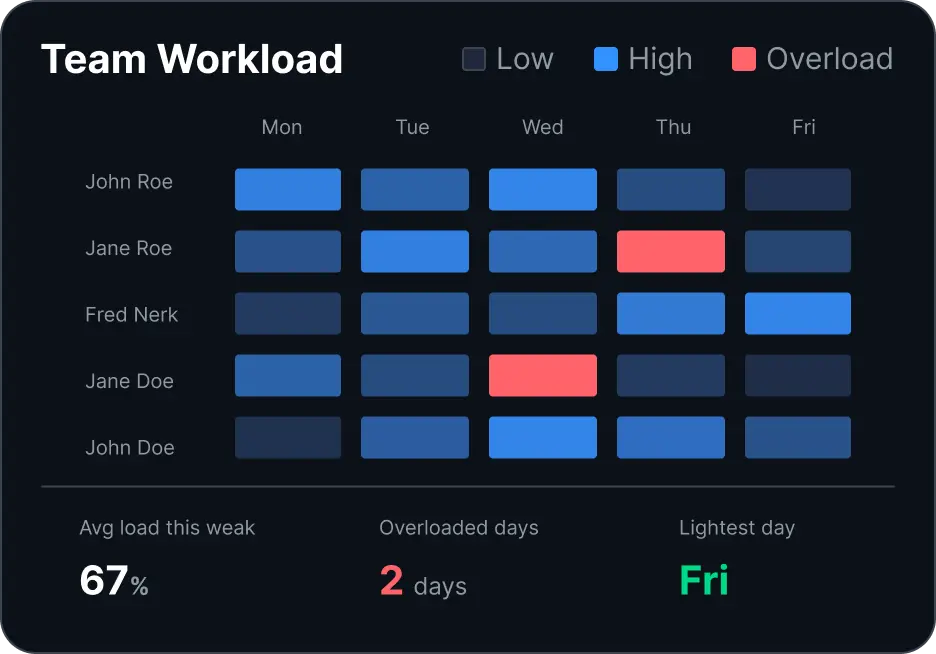
Team Workload Heatmap
Team workload heatmap uses opacity scaling on a single accent colour to show relative load per person per day. Red cells flag overloaded members, giving managers a signal to rebalance before burnout hits.
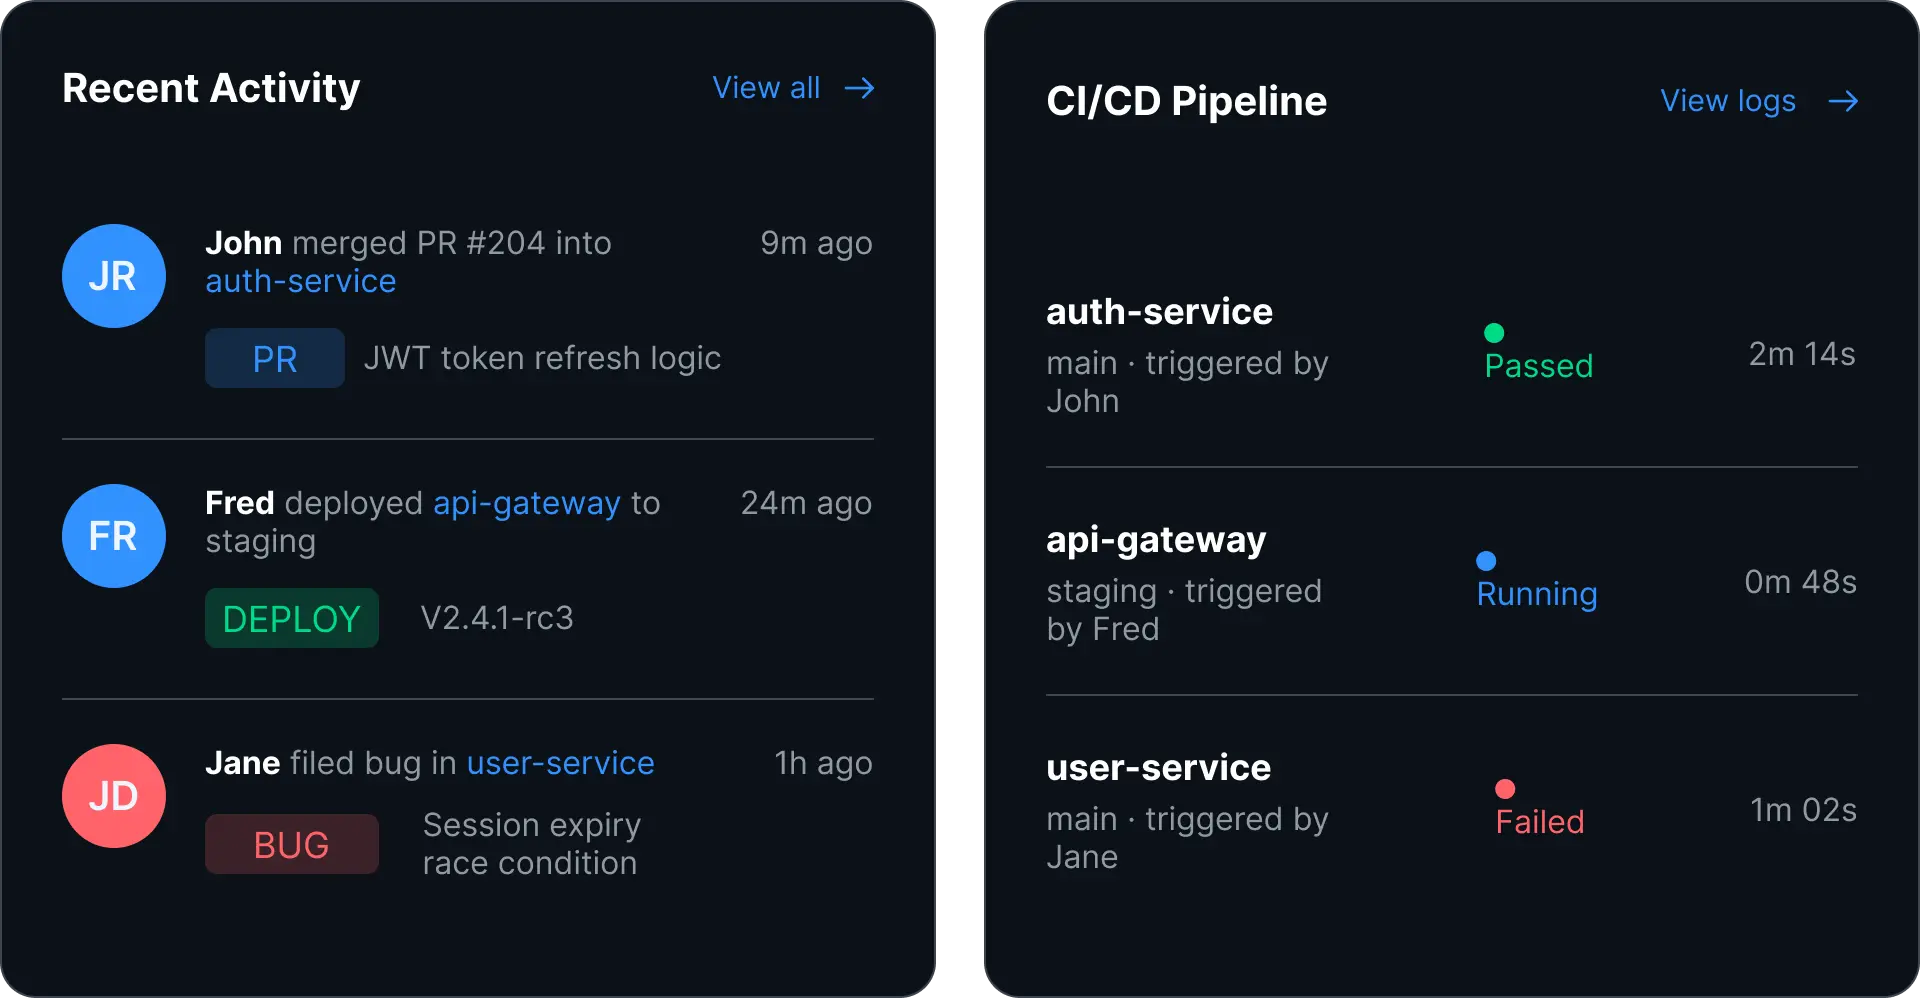
Activity Feed
Recent activity feed consolidates PR merges, deployments, and bug reports into a single chronological stream. Each item carries a color-coded tag — blue for PRs, green for deploys, red for bugs — so managers can scan by type at a glance.